mirror of
https://github.com/mum4k/termdash.git
synced 2026-04-27 03:15:55 +03:00
[GH-ISSUE #162] Entire canvas not used when specifying a large number of Bars in the barChart #98
Labels
No labels
bug
cleanup
enhancement
enhancement
enhancement
good first issue
help wanted
help wanted
pull-request
question
wontfix
No milestone
No project
No assignees
1 participant
Notifications
Due date
No due date set.
Dependencies
No dependencies set.
Reference
starred/termdash#98
Loading…
Add table
Add a link
Reference in a new issue
No description provided.
Delete branch "%!s()"
Deleting a branch is permanent. Although the deleted branch may continue to exist for a short time before it actually gets removed, it CANNOT be undone in most cases. Continue?
Originally created by @keithknott26 on GitHub (Mar 3, 2019).
Original GitHub issue: https://github.com/mum4k/termdash/issues/162
Hello,
Nice work on the button!
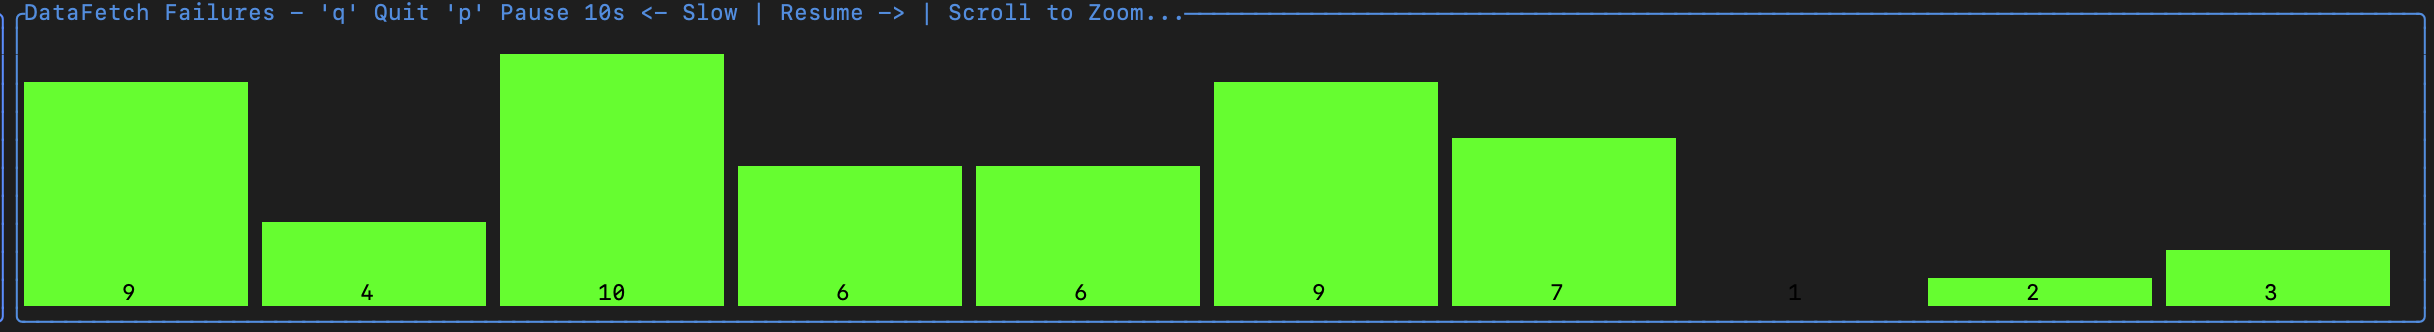
I was experimenting with different widgets and I found that when you specify a large number of bars (50+) for the barchart, that the barchart doesn't use the whole canvas like it does when there are say... 10 bars in use. Is this because of the text trimming that is taking place inside the bars? I have the showValues() option enabled.
10 Bars:
75 Bars:
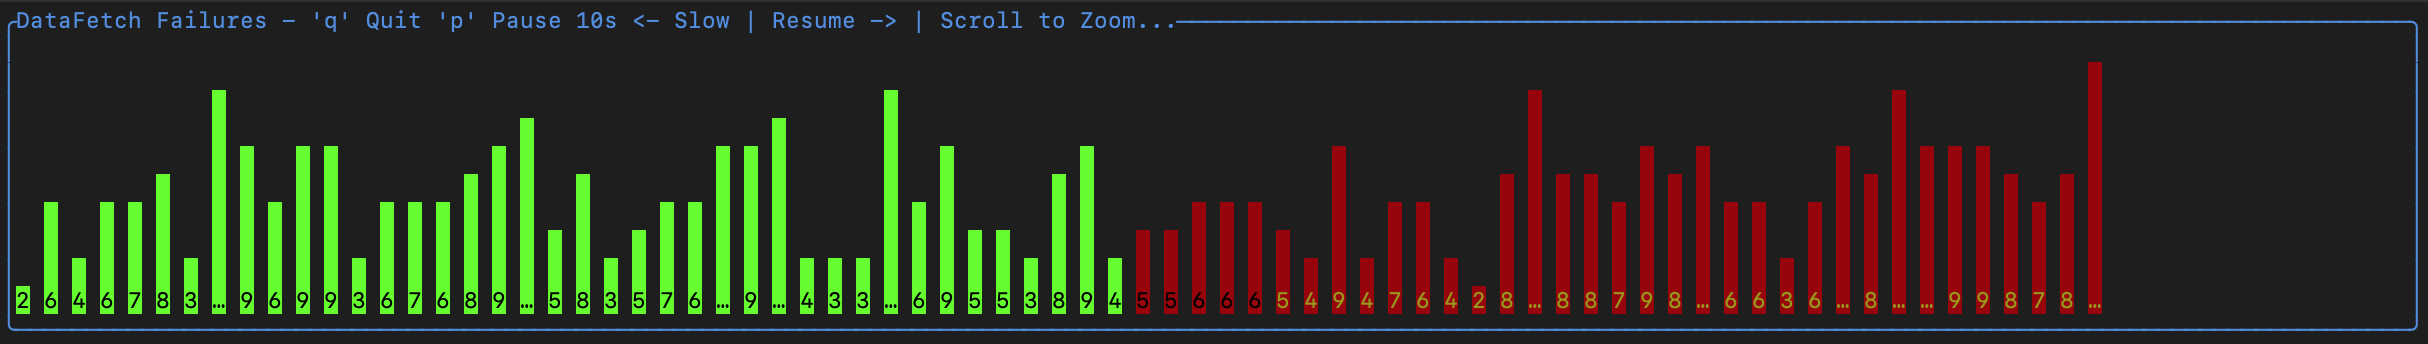
Additionally, would you be able to add a function that reports back the number of bars that fit on the canvas similar to what you added in the linechart lc.ValueCapacity()?
@mum4k commented on GitHub (Mar 3, 2019):
Hello and thanks again for the feedback and for staying in touch. Sure, we can add ValueCapacity for BarChart too. And probably for Sparkline as well as this seems to be useful to the callers.
Regarding the problem you described - this isn't because of the text trimming, but because the terminal is cell based. The BarChart ensures that all the bars have the same width, so when the chosen widts is one and we have 75 values - there will be 75 bars. Assuming that the canvas width is 100 cells, there will be 25 cells left empty.
The BarChart cannot change the width of all the bars to two, since 75 * 2 > the width of 100 cells. I would like to hear suggestions from you on whether we should improve this and how. We could add an option that will make BarChart use the full width by one of:
Originally I didn't do any of these as they result in an uneven look. Exposing the ValueCapacity indeed helps as it allows the caller to fill the BarCart exactly.
Please let me know what you think.
@keithknott26 commented on GitHub (Mar 3, 2019):
I think if something like valueCapacity is enabled there would be less need for option 1 or 2, but I lean towards option 2 since having unequal bar widths would be less visually appealing.. unequal spacing between the bar may also be less noticeable to the end user.
@mum4k commented on GitHub (Mar 3, 2019):
Sounds good, let me try and implement the ValueCapacity first.
I am hoping to get your feedback afterwards on whether (1) or (2) is still needed.
@mum4k commented on GitHub (Mar 3, 2019):
Both the BarChart and the SparkLine widgets now expose a ValueCapacity method. I have demonstrated this functionality in their respective demos. It is available in the devel branch.
As always feedback and suggestions are welcome.
@keithknott26 commented on GitHub (Mar 6, 2019):
Thank you!! Confirmed working for the sparklines and bar chart
@mum4k commented on GitHub (Mar 6, 2019):
Thank you very much for confirming.